In this blog, we will talk about Descending triangle – How to trade it?
A descending triangle is a bearish chart pattern that is formed when the price of an asset creates a series of lower highs and a flat support line. This pattern is typically seen as a sign that the asset’s price is likely to decrease.
The descending triangle pattern is formed by two trendlines. The first trendline is a horizontal support line that connects the lows of the asset’s price and it can be an area of support too instead of the trendline. The second trendline is a downward-sloping line that connects the highs of the asset’s price. As the price of the asset approaches the support line or support area, it is unable to break through and instead bounces off, creating lower highs.
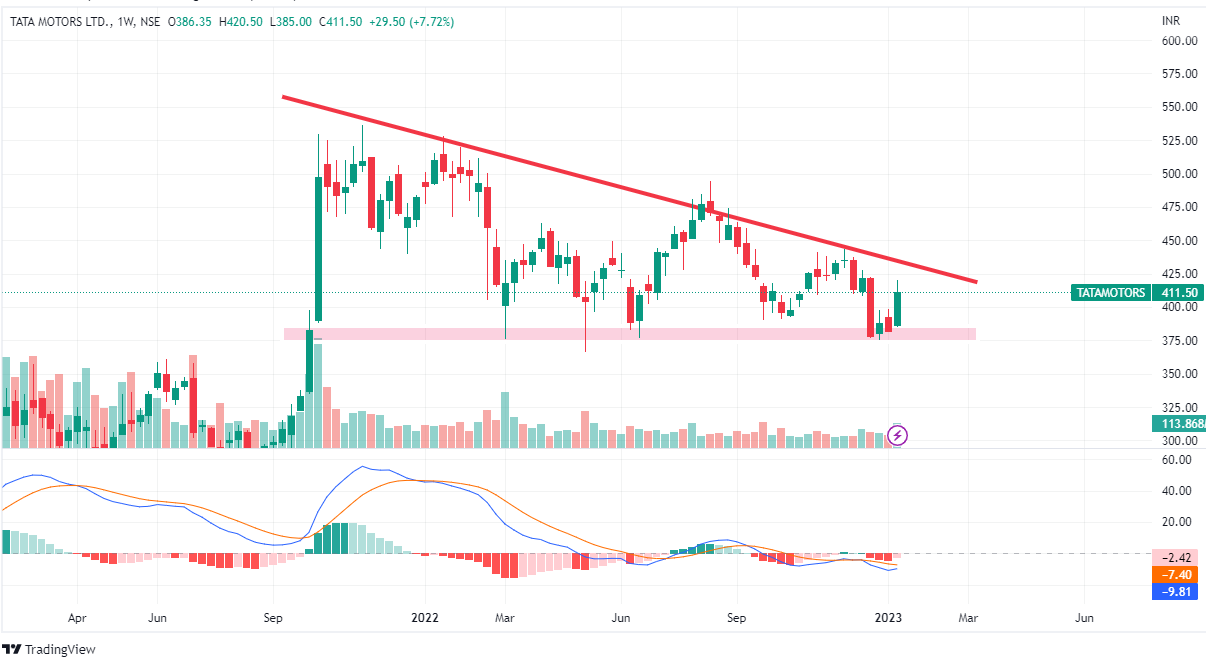
One of the key characteristics of a descending triangle is the decrease in volume as the pattern forms. We can see that in the chart of Tata motors, the volume has nearly died off. This decrease in volume is a sign that there is a lack of buying pressure and that the bears are in control.
It is often considered a bearish pattern and it is believed that the price of the asset will eventually break through the support line, leading to a significant price decline.
Traders often use the descending triangle pattern as a signal to enter a short position. It is important to note that the descending triangle pattern is not always accurate and it should be used in conjunction with other technical analysis tools to confirm the price direction.