Let us see what Inverted Head & Shoulders Pattern is.
Why this pattern is called as Head & Shoulder ? It is because of its similarity to the upper part of the human body mainly the head and shoulder including the neck line. This pattern is one of the most accurate pattern that indicates a reversal in the trend of the price of a stock. For ex – If the price of the stock is moving downward continuously for so many days and it starts making this pattern for some days, then the price of the stock shows that now the trend is going to reverse and the stock has bottomed out itself and should not fall further more from here. Similar indication is observed when the price is going upward and a head and shoulder pattern is formed indicates the price is going to reverse from here. Let us see in details about this chart from a live chart.
INHS pattern has three major components:-
- Head
- Two Shoulders ( Right and Left )
- Neckline
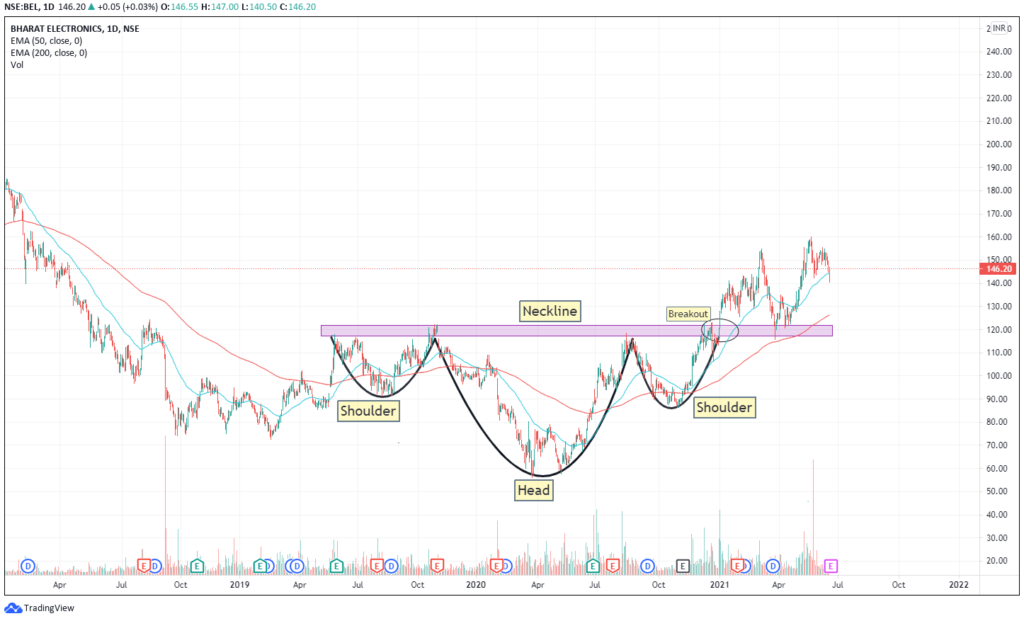
The pattern can be imagined with a head of a person and two shoulders placed on the left and right side of the head. The pink rectangular region can be thought of as the neckline passing through the base of the head and the shoulders. This pattern is normally formed at a time when the price of the stock is falling continuously over the time and there is no hope of any reversal.
This pattern brings a hope for the investors who were waiting for the price to reverse and go upwards while holding the stock in their portfolio. In the above chart also, the price of the BEL scrip has fallen down from Rs. 200-210 per share to Rs. 70-80 per share during the Covid-19 period where the businesses got hurt due to the lockdowns imposed. But gradually over the months the price formed a beautiful inverse head and shoulder pattern with a neckline as a resistance. There were 4 touches on this neckline but all got failed.
At the last when it tried for the fifth time, the breakout was successful and the neckline was broken out with a good volume suggesting that the pattern is not false. And as the neckline was broken, the price moved further higher without going below this neckline. So, the previous resistance has now become the new support for the price and it will require huge selling pressure to go below this level of 120-125. So, this pattern helps in identifying the reversal of the trend and gives a confirmation of taking entry in the stock as and when the neckline is broken.