Ascending triangle is by far the most reliable pattern, out of multiple continuation patterns. In this blog, we will learn to identify an Ascending triangle pattern, and will also try to learn How to trade Ascending triangle Pattern. Let us understand the pattern in brief. Lets learn How to trade Ascending triangle Pattern.
An ascending triangle is formed when the price is restricted between an upward sloping trendline (support) and a horizontal trendline or area (resistance).
Look at the picture below.
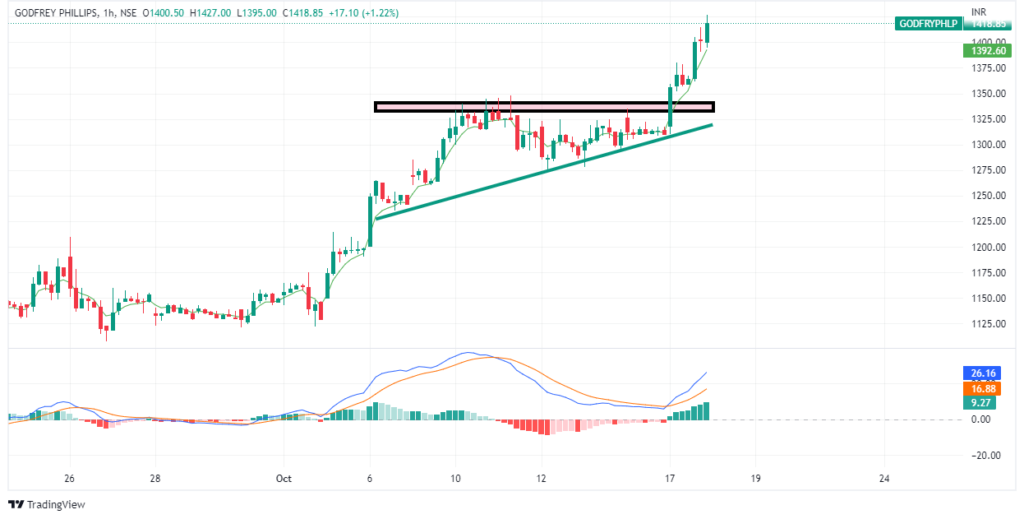
The green trendline is upward sloping trendline and it acts as support. The price bounced up several times from this trendline and is demand zone.
The Rectangular highlighted area in the chart acts as resistance or the supply zone. Price tried to cross this area several times, but it had to face rejections.
As the upward sloping trendline(support) comes closer to Rectangular area (Resistance), we are nearing a possible indecision zone. Whenever support and Resistance zone converge, the probability of breakout increases.
Since Ascending triangle is a continuation pattern, the price keeps moving in the same direction as before the formation of Ascending triangle. The patten might not always give decent breakout, but we can combine Ascending triangle with other indicators like Volume, MACD, RSI to improve the win probability.
Depending on the risk appetite, stoploss can be placed either below upward sloping trendline or below the breakout Candle.
We should stick to buy trades after breakout on the higher side. This will improve our win probability, as the momentum before the breakout was on the same direction. Always trade in the direction of momentum, and you will end up on winning side in longer run.