What is a Marubozu candlestick? In this blog we learn about Marubozu candles and the psychology behind trading the pattern.
In technical analysis of the stock market, traders look for patterns in the price and volume of securities to make predictions about future price movements. One such pattern is the marubozu, which is a single candle on a candlestick chart that has no shadow or wick on one end, signifying strong buying or selling pressure.
A bullish marubozu is a candlestick that has a long green body with no upper wick, indicating that buying pressure was strong throughout the trading session, pushing the price up from the open to the close. This pattern is usually seen as a strong bullish signal and traders may interpret this as a bullish trend reversal or a continuation of an existing bullish trend.
When a bullish marubozu forms, traders interpret it as a sign of strong buying pressure and confidence in the market. This may lead to increased optimism and a sense of security among traders, leading them to take long positions in the stock. The bullish sentiment may also lead to increased demand and further price appreciation, thus continuing the positive cycle.
On the other hand, a bearish marubozu is a candlestick that has a long black body with no lower shadow, indicating that selling pressure was strong throughout the trading session, pushing the price down from the open to the close. This pattern is usually seen as a strong bearish signal and traders may interpret this as a bearish trend reversal or a continuation of an existing bearish trend.
When a bearish marubozu forms, traders interpret it as a sign of strong selling pressure and bearish sentiment in the market. This may lead to increased fear and caution among traders, leading them to take short positions or exit long positions in the stock. The bearish sentiment may also lead to decreased demand and further price depreciation, further worsening the selling pressure.
It is important to note that market psychology is not always rational and can be influenced by various factors, such as news events, economic data releases, and rumors. Therefore, traders should not solely rely on candlestick patterns and should always consider multiple factors before making a trading decision.
The other common single candlestick patterns are Bullish Engulfing, Bearish Engulfing, and Inverted Hammer. Please click on respective links to access the blog.
What are Doji and Spinning top candlestick patterns? In this blog, we will look into two very important candle patterns.
Doji and spinning top candles are two important candlestick patterns that traders use to interpret market sentiment and make informed trading decisions. In this article, we’ll discuss what doji and spinning top candles are, how they are formed, and how traders use them to make trading decisions.
What is a Doji Candle?
A doji candle is a candlestick pattern that signals indecision in the market. It is formed when the opening and closing price of a security is almost the same, resulting in a candle with long wicks on both the upper and lower end. The long wicks show that both buyers and sellers have attempted to push the price in opposite directions, but neither side was able to gain control. This results in a candle with a small real body that is often situated near the middle of the candle’s high and low range.
What is a Spinning Top Candle?
A spinning top candle is a similar pattern to the doji candle, but it is formed when the real body of the candle is larger and the upper and lower wicks are still relatively long. The spinning top candle also signals indecision in the market, as the larger real body shows that both buyers and sellers have taken control of the price at some point during the trading session, but neither side was able to gain a sustained advantage.
How to Use Doji and Spinning Top Candles in Trading
Doji and spinning top candles are most effective when used in conjunction with other technical analysis tools, such as trend lines, support and resistance levels, and moving averages. Traders often look for doji and spinning top candles at key levels of support and resistance, as they can signal a potential reversal in the trend.
In the pic above, the first green candle is close to what doji would look like. The third red candle which has a thicker body is close to what a spinning top would look like.
For example, if a doji or spinning top candle forms at a key resistance level, it may indicate that the price has reached a top and that a downward trend could soon follow. On the other hand, if a doji or spinning top candle forms at a key support level, it may indicate that the price has reached a bottom and that an upward trend could soon follow.
The other common single candlestick patterns are Marubozu and Inverted Hammer. Please click on respective links to access the blog.
A candlestick is a type of chart that is commonly used in technical analysis to display the price movements of a financial instrument, such as a stock, currency, or commodity, over a specific period of time. Each candlestick is represented by a “real body” which displays the open and close prices and “tails/wicks”, which display the highest and lowest prices reached during the period.
The red rectangular part as seen in the image above is called body and the thin line on top and bottom of body is called tail/wick/shadow.
In a candlestick pattern, the body represents the area between the open and close prices of a financial instrument during a specific period of time. The body is typically shown as a rectangle and its color can indicate the direction of price movement. A white or green body indicates that the closing price was higher than the opening price, indicating a bullish movement, while a black or red body indicates that the closing price was lower than the opening price, indicating a bearish movement.
The tail/wick is the line above or below the body that represents the high or low price for the period. A tail above the body is called an upper tail or upper wick, and it represents the highest price reached during the period. A tail below the body is called a lower tail or lower shadow, and it represents the lowest price reached during the period.
In a candlestick chart, the upper and lower tails can provide insight into market sentiment. For example, a long upper tail on a candle can indicate that bears (sellers) tried to push the price down and were ultimately successful, indicating that bulls (buyers) lost the grip. Similarly, a long lower tail on a candle can indicate that bears(sellers) tried to push the price down but were ultimately unsuccessful, indicating that bulls (buyers) tightened the control.
It’s worth noting that the length and position of the tails can provide additional information about the market sentiment and can be used to identify potential buying and selling opportunities.
In other blogs we will look into most common single candlestick patterns like Hammer and Shooting star, Marubozu, spinning top, Doji and Hanging Man.
What are single candlestick patterns? How to trade them?
Single candlestick patterns are a popular tool used in technical analysis to predict future price movements in financial markets. These patterns are formed by a single candlestick and can provide insight into the sentiment of market participants.
There are several single candlestick patterns that are commonly used in technical analysis: We will look into hammer and shooting star in this blog.
Hammer
One of the most well-known single candlestick patterns is the “hammer” pattern. This pattern forms when the market opens at a high price, falls during the trading session, and then closes near the opening price. The long lower tail of the candlestick indicates that bears (sellers) were pushing prices down during the session, but bulls (buyers) ultimately stepped in to bring prices back up. The hammer pattern is considered a bullish reversal pattern, indicating that a downtrend may be coming to an end and that prices are likely to rise in the future.
Shooting Star
Other popular single candlestick pattern is the “shooting star” pattern. This pattern forms when the market opens at a low price, rises during the trading session, and then closes near the opening price. The long upper tail of the candlestick indicates that bulls (buyers) were pushing prices up during the session, but bears (sellers) ultimately stepped in to bring prices back down. The shooting star pattern is considered a bearish reversal pattern, indicating that an uptrend may be coming to an end and that prices are likely to fall in the future.
It’s important to remember that these patterns should be used in conjunction with other forms of technical analysis and fundamental analysis to make more accurate predictions. Also, it’s important to look for confirmation of these patterns through the formation of other patterns or indicators.
In this blog, we will talk about Descending triangle – How to trade it?
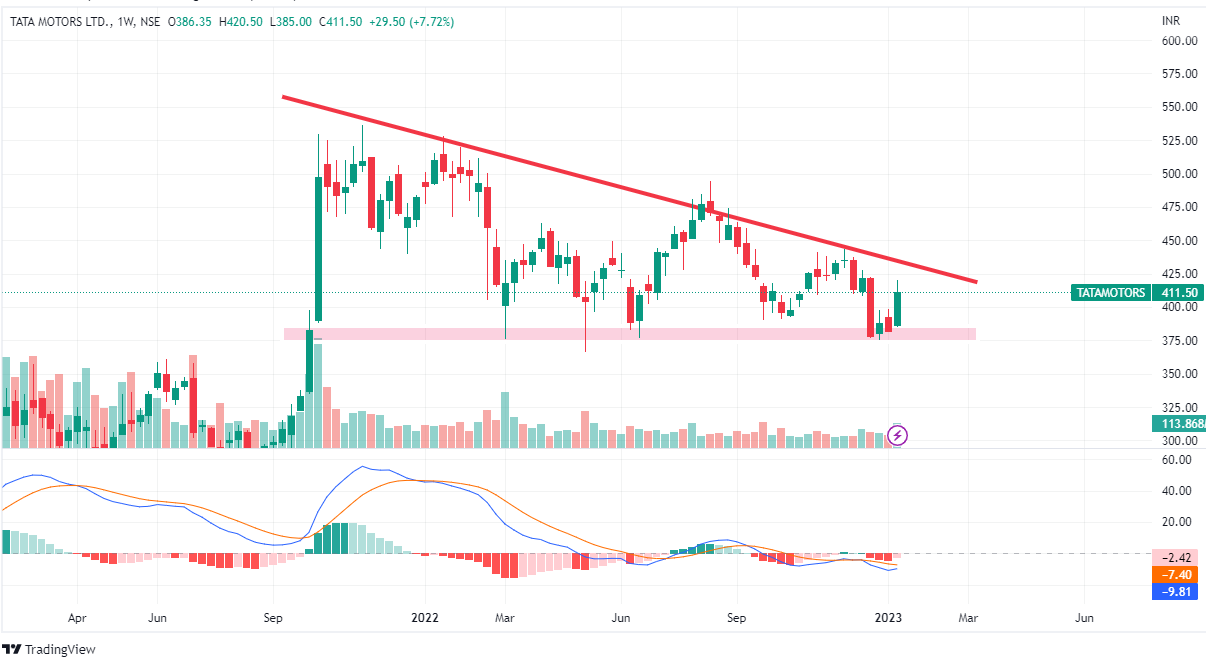
A descending triangle is a bearish chart pattern that is formed when the price of an asset creates a series of lower highs and a flat support line. This pattern is typically seen as a sign that the asset’s price is likely to decrease.
The descending triangle pattern is formed by two trendlines. The first trendline is a horizontal support line that connects the lows of the asset’s price and it can be an area of support too instead of the trendline. The second trendline is a downward-sloping line that connects the highs of the asset’s price. As the price of the asset approaches the support line or support area, it is unable to break through and instead bounces off, creating lower highs.
One of the key characteristics of a descending triangle is the decrease in volume as the pattern forms. We can see that in the chart of Tata motors, the volume has nearly died off. This decrease in volume is a sign that there is a lack of buying pressure and that the bears are in control.
It is often considered a bearish pattern and it is believed that the price of the asset will eventually break through the support line, leading to a significant price decline.
Traders often use the descending triangle pattern as a signal to enter a short position. It is important to note that the descending triangle pattern is not always accurate and it should be used in conjunction with other technical analysis tools to confirm the price direction.
Ascending triangle is by far the most reliable pattern, out of multiple continuation patterns. In this blog, we will learn to identify an Ascending triangle pattern, and will also try to learn How to trade Ascending triangle Pattern. Let us understand the pattern in brief. Lets learn How to trade Ascending triangle Pattern.
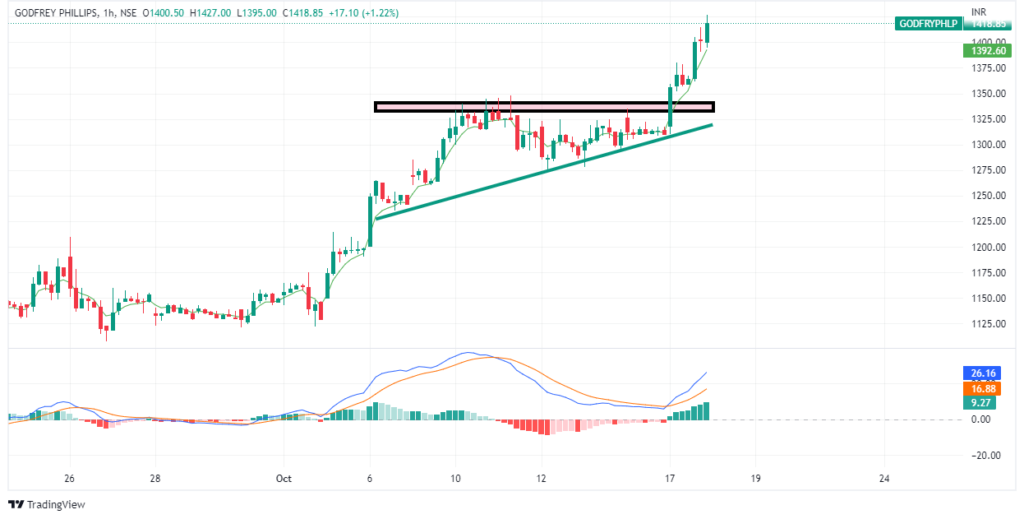
An ascending triangle is formed when the price is restricted between an upward sloping trendline (support) and a horizontal trendline or area (resistance).
Look at the picture below.
The green trendline is upward sloping trendline and it acts as support. The price bounced up several times from this trendline and is demand zone.
The Rectangular highlighted area in the chart acts as resistance or the supply zone. Price tried to cross this area several times, but it had to face rejections.
As the upward sloping trendline(support) comes closer to Rectangular area (Resistance), we are nearing a possible indecision zone. Whenever support and Resistance zone converge, the probability of breakout increases.
Since Ascending triangle is a continuation pattern, the price keeps moving in the same direction as before the formation of Ascending triangle. The patten might not always give decent breakout, but we can combine Ascending triangle with other indicators like Volume, MACD, RSI to improve the win probability.
Depending on the risk appetite, stoploss can be placed either below upward sloping trendline or below the breakout Candle.
We should stick to buy trades after breakout on the higher side. This will improve our win probability, as the momentum before the breakout was on the same direction. Always trade in the direction of momentum, and you will end up on winning side in longer run.
I am often asked, how did I pick up trading and how did I learn trading? At the end of conversation, I would forward some link. The links often depend on the questions asked. I will update this blog with all the questions possibly asked and answers to them.
Q. How do I select a broker to open my account.
The answer to this question varies depending on what the person is looking for. For beginners, Zerodha is great. I would also recommend Fyers since it has some cool features for advanced traders.
I started trading in 2016 and back then we had very few reliable sources to learn. I had put my time into multiple youtube videos but I found zerodha varsity blog to be complete and concise. Please check this out.
Q. Where from one can learn about Options, Premium, Put Call etc?
You can learn about basic terminologies from on of the youtube video here. His language is simple and easy to understand. You can also read this article here.
Q. What are tradable patterns and how do I learn about them?
Today I would like to write about a useful but less talked about topic today. The post will talk about “trading index futures with minimal margin”. It is useful for new traders, as well as someone who is working on improving their hit ratio. Hit ratio is the percentage of trades that go in your favour as compared to the total trades that you take.
As a beginner, it is normal that one cannot take a trade in the Index futures just because the lot size is big and the losses can run huge if we keep a decent stop loss. If we keep a small stop loss, we will mostly get it hit since futures and options are highly volatile.
What if I tell you that you can trade futures and options with a lot size of your own, that is you can scale your lot size according to your stop loss. I have described in an earlier post, how to scale your lot size according to your stop loss.
However, we can only trade in Nifty and Banknifty and not other stocks listed in the futures and options segment, and we are not trading in nifty and banknifty futures but an equivalent of nifty and BankNifty futures. Let us jump into the topic right away.
The equivalent of Bank Nifty is bankbee. However, we have to follow the spot chart of the Banknifty index but buy/sell Bankbee as per the quantity of your choice. Remember to keep a stoploss as per your judgement. One can check index price and decide a stoploss in bankbee.
It is not a straightforward thing to do, but a simple suggestion is to check the time at which price had touched stoploss last time in the Index chart and check the price in Bankbee at the same time. The candle close in the 5-minute time frame in bankbee can be a decent stoploss price.
Bankbee and banknifty move in the same direction by almost the same percentage. The benefit of trading in bankbee is that we do not need to buy a full lot to take a position. Instead, we can buy a single bankbee just like buying a single stock of ITC or Reliance. The problem with buying bank Nifty futures is that even a hundred rupees stop loss a stop loss of 2500 rupees per lot.
If we make the same position in by bankbee which trades at almost 400 rupees nowadays, we can virtually take the same trade with smaller stoploss. It reduces the amount that is risked in a trade as well as the amount that can be gained in the same trade. Let me tell you how to take a trade in bankbee.
Let us look at today’s chat of bank Nifty index. We found a buying opportunity at 11:45 a.m. and the trade hits take profit at 12:45 a.m. Remember to make an entry and exit following the index chart.
We can buy bankbee at 11:45am and wait for stoploss or target. We can see that the target is hit at 12:45
Let us look at bankbee chart for the same day, and how it progressed during the same time frame.
Entry and exits are shown by blue arrows in the bankbee chart. The entry price would be near 400.29 and the exit would be at 402. For intraday trades, you get leverage of 5X in Zerodha for Bankbee and the effective buy price would drop to 80.08. You end up making 1.7 rs by buying one quantity for 80.08 rs. This turns out to be 2.1 per cent for the day which is quite good.
The equivalent of Nifty is niftybee and you can virtually trade nifty futures by making a position in Nifty bee.
One point to be noted is that the niftybee and bankbee often have a small gap in best buyer and seller price and one must use a limit order to enter and exit to the extent it is possible. Once you are confident in trading bankbee and nifty bee, you can try out nifty and banknifty futures.
What are your thoughts on this post, let us know in the comments.
One of the questions that I often come across is, “How to place a stop loss? What should be the maximum loss that I should take before closing the position in a losing trade?“
Money management is one of the most important skills that a trader should possess in order to become successful in the stock market. Stop loss is what helps us in managing our capital in an efficient way. Proper money management ensures that one can take multiple Trades without wiping of our entire capital.
You should always make sure that the maximum loss you should take in a single trade should not be more than five per cent of your capital. So if you are starting with a capital of 10000 Rupees, you should not lose more than 500 rupees in a single trade. Similarly, if your capital is 100000 rupees, you should make sure that you do not lose more than 5000 rupees in a single trade.
The initial capital will vary from person to person so would the maximum loss that a person can take. If you follow proper money management, you can take 20 trades at a time. I do not suggest you take 20 trades at a time, I am just pointing out that you should be wrong 20 times to lose your entire capital.
What if you did not follow money management with a maximum 5 % stop loss? You let your losses run huge and maybe after 4-5 wrong trades, your entire capital will be wiped out. Let us learn to place a proper stop loss and preserve our capital.
Once you have decided how much maximum loss you as a trader can take in a single trade, now you have to decide the quantity that you can buy or sell. How can you decide the quantity? Quantity would be nothing but the maximum loss you can take divided by the maximum loss per share that you have decided based on your analysis of support, resistance, EMA, 200 EMA, trend lines etc.
Suppose ITC is trading at 200 rupees and has strong support at 198 rupees. You are hopeful that ITC would not breach 198 rupees level on the downside. This can act as good support and your stop loss could be placed below 198. That would be a stop loss of 2 Rupees per share.
A person with an initial capital of 10000 can lose a maximum of 500 if 5% rule of money management is kept in mind. The trader has also noted that he can place a stop loss of 2 rupees on a buy trade in ITC. So the trader can go into the buy trade with 250 quantity.
Similarly, if a trader has an initial capital of 100000 rupees, he can go into the buy trade in ITC with 2500 quantity.
Futures and options are derivative products. The value of the derivative product is determined by an underlying asset. The underlying asset can be stock, index or commodity. We will restrict the discussion to the equity market as the aim of the blog is to give a clear understanding of options and how good is option buying. Those who have some idea of Futures and options would find this blog really helpful. If you are a beginner, and interested in learning about futures and options, I would urge you to go through these two posts and return to this post later.
We would learn about options from an option buyers standpoint in this post. We would cover option selling in a later post.
When would you want to buy a stock or an index option
A. We can buy an option when we want to trade a directional move
After some analysis, you feel nifty can show a sharp up move and you want to make some gain out of the would-be movement. What are your options? We would restrict ourselves to buying option. You know you have to but a Call option. Let’s see this chart for our test case.
Let us go for buying a call. Here we have three choices, buying deep in the money call option, buying at the market call option and buying out of the money call option. All these scenarios are analyzed and we see that all these turn profitable. We can clearly see that choosing the best strike price has the potential to affect your profitability. Although when one buys deep in the money option, he pays less for the time decay and pays mostly for the intrinsic value of the option. Small reversals do not affect the Profit and loss in such a position. You can go through this blog to understand time decay and intrinsic value.
Entry Price
Price per lot
Lot Size
Lots you can buy with 5 Lakh
Exit / Day Close Price
Profit at day close
Nifty 15200 CE 3rd June 2021
342
25650
75
19
395
75525
Nifty 15500 CE 3rd June 2021
74.85
5613.75
75
89
108.05
127158.75
Nifty 15800 CE 3rd June 2021
6.85
513.75
75
973
8.20
98516
Profitability table for call buy
B. We can buy an option when we want to hedge a cash Position
Let us understand this with an example. Suppose you are very bullish on ITC in long term. You have bought 3200 shares of ITC at an average price of 200₹. You sense that in short term ITC may correct by 20 per cent, and it might go to 160₹ per share. In spite of that, you don’t want to exit the cash position since there is always a chance that it might not correct much and maybe rally up.
In such a case, you can still protect your holdings against the suspected correction of 40₹. This can be done by buying at the Money put or Deep in the Money Put. Note that the Put option can be bought in multiples of lot size. Right now the lot size of ITC is 3200 and one lot of ITC put can help in hedging 3200 ITC shares. We can buy ITC Put of 200 strike price and we are protected against any downside in ITC beyond 200₹.
If the ITC closes at 170₹ at end of the contract period, you can make a gain of 96000 (minus the premium paid) in Put option. Though you will see the value of the holdings of ITC has decreased by 96000, but you have not exited the holding value and booked no loss in it. You can still close the holdings position at 170₹. In such a case you will end up making no loss as the gain in the put option is same as the loss booked in cash holdings. This way we can hedge our positions in cash segment.
C. We can buy an option when we want to hedge a Futures position
This is similar to hedging a cash position, except that we have gone long in futures and bought the Put option to hedge long position. Suppose you are very bullish on ITC and bought one lot of ITC futures. The average buy price is 200₹. You sense that the price can dip a little in the next few days. You can either exit with a predefined stop-loss or hedge the position by buying at the money or in the money put option of a suitable strike price. Any loss in futures position will be covered by put option. In case of upside, the gain would be ideally infinite. So you can make a limited loss, unlimited gain strategy using this.
D. We can buy an option when we want to hedge an option sell/short Position
We can sell options as well. You can read more about prospects of options selling here in this blog. Options selling requires good capital and money management skills. If one is not active enough, the losses can be infinite. To protect yourself against infinite loss, you can buy an option too. This will ensure that the loss is finite.
ITC has been trading rangebound for quite some time. We suspect that it cannot go any lower than 200₹. We can sell PUT option of strike price 200₹. We can track trading price live at NSE website here. Suppose 200₹ strike price PUT is trading at 1.2₹. If we sell this option, we get a credit of 3840₹. This credit amount is product of lot size and trading price.
Maximum loss in selling this option is almost 6,40,000₹ if ITC price goes to zero. if we do not want to take a risk of 640000₹ to gain 3840₹, we can buy a PUT option of lower strike price in this case. One can buy 190₹ strike price Put option and limit the losses. We can make various options strategies using buy and sell combinations. Although option selling has a higher probability of success, it comes with a risk of huge losses. We can limit these losses by buying an option.