What is a candlestick pattern? How to read them?

What is a candlestick?

A candlestick is a type of chart that is commonly used in technical analysis to display the price movements of a financial instrument, such as a stock, currency, or commodity, over a specific period of time. Each candlestick is represented by a “real body” which displays the open and close prices and “tails/wicks”, which display the highest and lowest prices reached during the period.

What is a Candlestick?
A bearish Candlestick

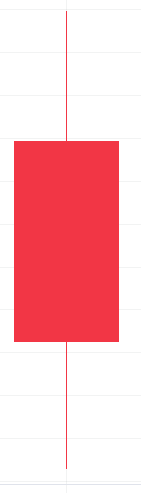
The red rectangular part as seen in the image above is called body and the thin line on top and bottom of body is called tail/wick/shadow.

In a candlestick pattern, the body represents the area between the open and close prices of a financial instrument during a specific period of time. The body is typically shown as a rectangle and its color can indicate the direction of price movement. A white or green body indicates that the closing price was higher than the opening price, indicating a bullish movement, while a black or red body indicates that the closing price was lower than the opening price, indicating a bearish movement.

The tail/wick is the line above or below the body that represents the high or low price for the period. A tail above the body is called an upper tail or upper wick, and it represents the highest price reached during the period. A tail below the body is called a lower tail or lower shadow, and it represents the lowest price reached during the period.

In a candlestick chart, the upper and lower tails can provide insight into market sentiment. For example, a long upper tail on a candle can indicate that bears (sellers) tried to push the price down and were ultimately successful, indicating that bulls (buyers) lost the grip. Similarly, a long lower tail on a candle can indicate that bears(sellers) tried to push the price down but were ultimately unsuccessful, indicating that bulls (buyers) tightened the control.

It’s worth noting that the length and position of the tails can provide additional information about the market sentiment and can be used to identify potential buying and selling opportunities.

In other blogs we will look into most common single candlestick patterns like Hammer and Shooting star, Marubozu, spinning top, Doji and Hanging Man.

What are Single candlestick patterns? How to trade them?

What are single candlestick patterns? How to trade them?

Single candlestick patterns are a popular tool used in technical analysis to predict future price movements in financial markets. These patterns are formed by a single candlestick and can provide insight into the sentiment of market participants.

There are several single candlestick patterns that are commonly used in technical analysis: We will look into hammer and shooting star in this blog.

Hammer

One of the most well-known single candlestick patterns is the “hammer” pattern. This pattern forms when the market opens at a high price, falls during the trading session, and then closes near the opening price. The long lower tail of the candlestick indicates that bears (sellers) were pushing prices down during the session, but bulls (buyers) ultimately stepped in to bring prices back up. The hammer pattern is considered a bullish reversal pattern, indicating that a downtrend may be coming to an end and that prices are likely to rise in the future.

Single candlestick patterns
Hammer candle formation after a downmove. Stock starts rallying after hammer formation

Shooting Star

Other popular single candlestick pattern is the “shooting star” pattern. This pattern forms when the market opens at a low price, rises during the trading session, and then closes near the opening price. The long upper tail of the candlestick indicates that bulls (buyers) were pushing prices up during the session, but bears (sellers) ultimately stepped in to bring prices back down. The shooting star pattern is considered a bearish reversal pattern, indicating that an uptrend may be coming to an end and that prices are likely to fall in the future.

Single candlestick pattern
A shooting star is formed after market rally. Stock starts down move after forming shooting star

It’s important to remember that these patterns should be used in conjunction with other forms of technical analysis and fundamental analysis to make more accurate predictions. Also, it’s important to look for confirmation of these patterns through the formation of other patterns or indicators.

In other blogs we will look into most common single candlestick patterns like Hammer and Shooting star, Marubozu, spinning top, Doji and Hanging Man.

Descending Triangle – How to Trade?

In this blog, we will talk about Descending triangle – How to trade it?

A descending triangle is a bearish chart pattern that is formed when the price of an asset creates a series of lower highs and a flat support line. This pattern is typically seen as a sign that the asset’s price is likely to decrease.

The descending triangle pattern is formed by two trendlines. The first trendline is a horizontal support line that connects the lows of the asset’s price and it can be an area of support too instead of the trendline. The second trendline is a downward-sloping line that connects the highs of the asset’s price. As the price of the asset approaches the support line or support area, it is unable to break through and instead bounces off, creating lower highs.

One of the key characteristics of a descending triangle is the decrease in volume as the pattern forms. We can see that in the chart of Tata motors, the volume has nearly died off. This decrease in volume is a sign that there is a lack of buying pressure and that the bears are in control.

Descending Triangle Pattern – Tata motors

It is often considered a bearish pattern and it is believed that the price of the asset will eventually break through the support line, leading to a significant price decline.

Traders often use the descending triangle pattern as a signal to enter a short position. It is important to note that the descending triangle pattern is not always accurate and it should be used in conjunction with other technical analysis tools to confirm the price direction.